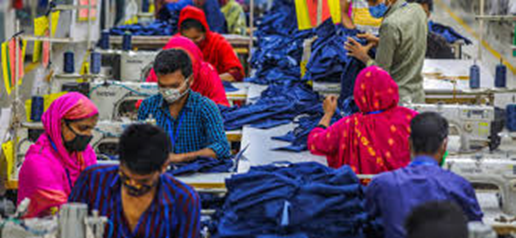
Discover data-driven insights from 1,000+ Bangladeshi garment factories. Learn about capacity optimization strategies, regional clusters, automation benefits, and how to mitigate risks in this $35 billion export sector
Introduction
Bangladesh’s ready-made garment (RMG) sector isn’t just the heartbeat of the nation’s economy – contributing 80% of export earnings – it’s also one of the world’s most fascinating industrial ecosystems. Through data analysis of 1,000+ BGMEA-registered factories, we’ve uncovered actionable insights that can help manufacturers optimize operations, buyers streamline sourcing, and policymakers target infrastructure investments.
🔗 Explore the Project Further:
Key Findings at a Glance
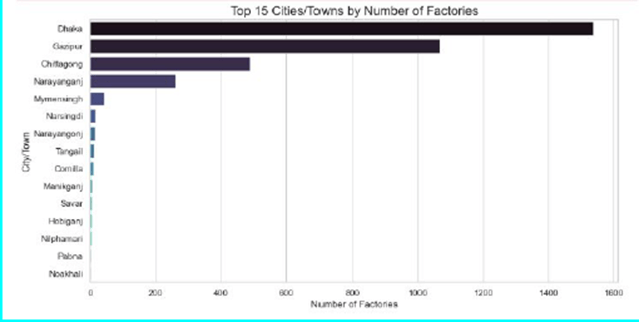
- 🏭 Gazipur dominates with 60% of top factory locations
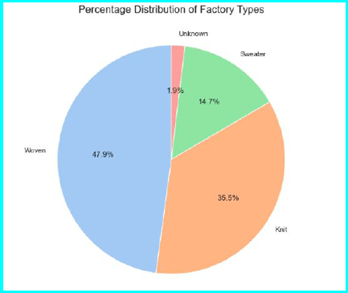
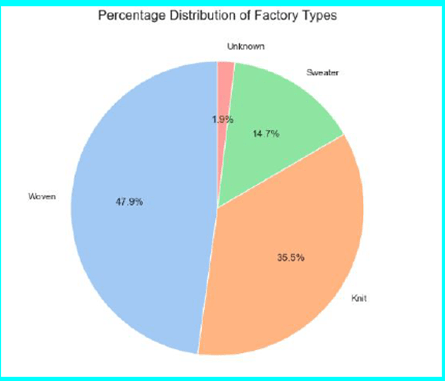
- 🧵 Woven factories lead (47.9% of total) with highest ROI for upgrades
- ⚙️ Automation pays off – +10% machines = -4% labor needs
- 📈 Cluster 0 produces 32.4% of total capacity (Highest ROI)
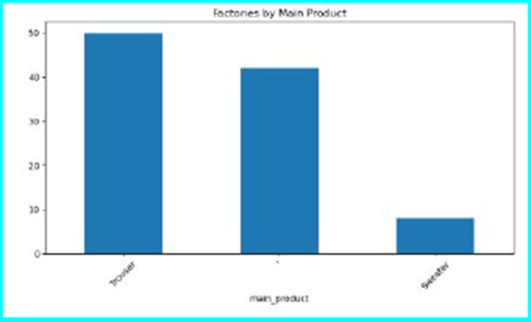
- ⚠️ Risk alert: Top 2 products account for ~45% of factories
Geographic Hotspots
The data reveals a striking concentration pattern:
Gazipur Epicenter
- Home to 1,600 factories (60% of top locations)
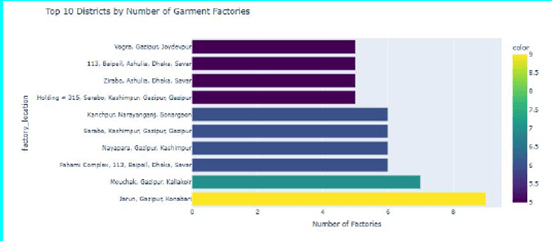
- Key areas: Kashimpur, Joydevpur, Konabari
- Industrial zones like Fahami Complex show highest density
Dhaka-Savar Cluster
- 1,400 factories (30% share)
- Notable concentrations around Ashulia and Baipail
Emerging Opportunities (H3)
- Narayanganj (only 10% representation) shows potential for growth
- Chittagong’s 800 factories benefit from port access
Factory Types & Capacity
The Woven-Knit Duopoly
Our analysis shows a clear segmentation:
- Woven factories: 47.9% share (shirts, trousers, denim)
- Knit factories: 35.5% (T-shirts, undergarments)
- Sweater factories: 14.7% (niche winterwear segment)
Capacity Pyramid
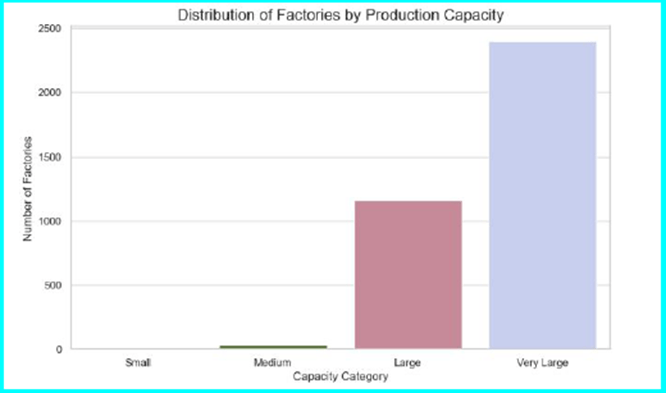
Bangladesh’s factories show a classic power-law distribution:
- Small/Medium (60-70% of factories): <100,000 dozen/year
- Large/Very Large (30-40%): Produce 80%+ of output
- Mega factories (>1M pieces): Only 5-10% of units but handle 60%+ exports
The 4 Factory Clusters
Machine learning (K-means clustering) revealed four distinct factory groups:
- Cluster 0 (Purple): 32.4% of capacity – Diverse, high-output
- Cluster 1 (Blue): “Typical” factories – Balanced operations
- Cluster 2 (Teal): 11.5% capacity – Needs upgrades
- Cluster 3 (Yellow): 29% capacity – Elite performers
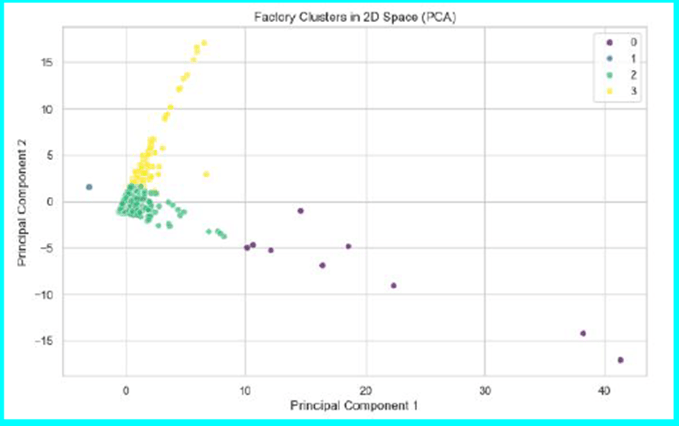
Pro Tip for Buyers: Cluster 0 handles big orders best, while Cluster 2 suits premium small batches.
Automation Insights
The numbers tell a compelling story:
- Industry average: 2 workers per machine
- Top performers: 0.95 workers/machine (3N Fashion)
- Labor-intensive outliers: Up to 40.4 workers/machine
Efficiency Champions:
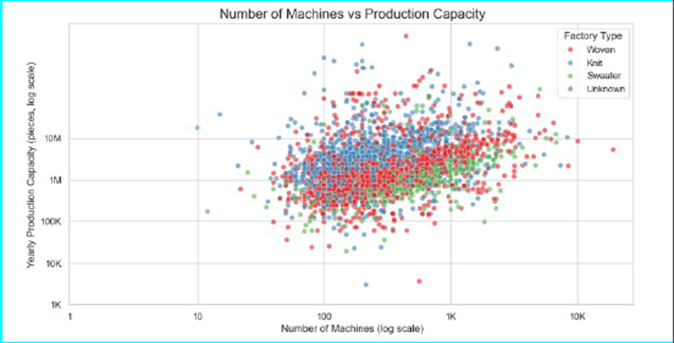
- T-Shirts: 3.5 pieces/machine (Fastest)
- Sweaters: Only 0.5 pieces/machine (Most manual)
Actionable Recommendations
For Factory Owners
- Prioritize Cluster 0 upgrades (ROI up to 100%)
- Woven factories: Automate further (steepest capacity/machine slope)
- Sweater factories: Invest in linking machines
For Buyers
- Bulk orders: Partner with very large woven factories
- Mid-volume: Knit factories with 20-100 machines
- Premium items: Specialty sweater factories
For Policymakers
- Gazipur: Upgrade utilities/transport
- Cluster 2: Targeted worker training programs
- Narayanganj: Develop river-adjacent infrastructure
Risk Mitigation Strategies
Our analysis uncovered two critical vulnerabilities:
- Product concentration: Top 2 products = ~45% of factories
- Geographic concentration: Top 2 clusters = 61.4% of capacity
Solutions:
- Diversify production to Cluster 2 facilities
- Develop emerging hubs like Narsingdi (400-600 factories)
- Incentivize product diversification among small-medium factories
Conclusion
Bangladesh’s garment industry stands at a fascinating crossroads – a blend of traditional labor-intensive operations and emerging automation. The data shows clear paths to:
- Boost capacity by 25-100% in key clusters
- Reduce risks through geographic/product diversification
- Improve efficiency through targeted automation
As a BGMEA official aptly noted: “The garment industry is not just our economic engine—it’s the livelihood of millions.” These data-driven insights can help ensure this engine keeps running smoothly for decades to come.
Call-to-action
Want the full dataset or custom analysis for your sourcing strategy? Contact me today





Leave a comment