
Introduction
Let’s face it: oil prices are a rollercoaster. From geopolitical tensions to economic booms and busts, countless factors send those numbers soaring and plummeting. And trying to predict where they’ll go next? That’s a puzzle that has challenged experts for ages. But what if we could use the power of machine learning to get a clearer view of the road ahead? That’s precisely what we set out to do in our oil price forecasting project. We aimed to build a model that could analyze historical data and give us more accurate predictions, and in this blog post, I’ll walk you through the key steps.
Project Resources
For those wanting to dig deeper, here’s a concise overview of where to find the project’s resources:
Understanding the Fuel: The Dataset
To build a solid forecasting model, you need solid data. We used data from Yahoo Finance and FRED (Federal Reserve Economic Data), giving us a rich dataset with daily price information and other economic indicators.
We analyzed a range of energy commodities:
- Brent Crude: A major global benchmark.
- WTI Crude: The US benchmark.
- Natural Gas: Essential for heating and power.
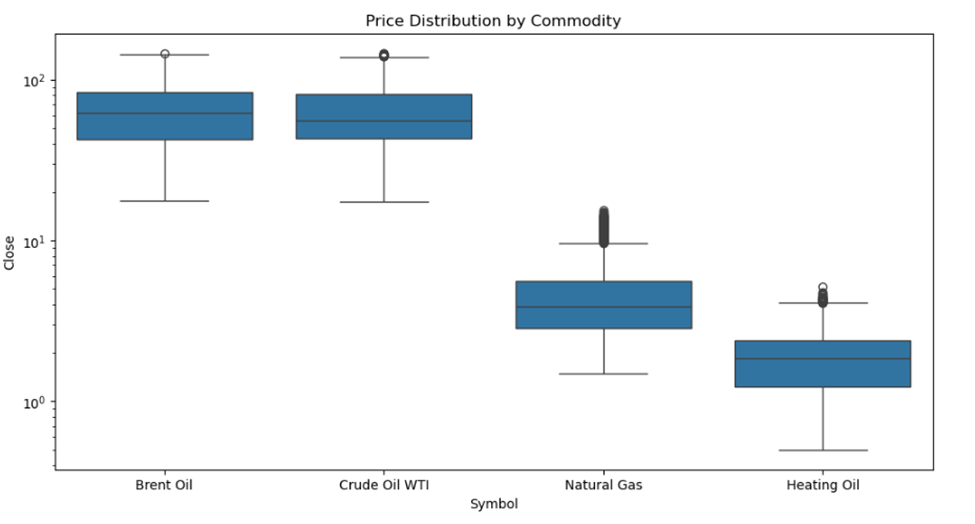
Our dataset spanned from 2000 to 2023 (as an example), capturing long-term price fluctuations. Key data included:
- OHLCV Data: Open, High, Low, Close, Volume.
- Technical Indicators: SMA (Simple Moving Average), RSI (Relative Strength Index).
- Lagged Values: Past prices.
Our Secret Sauce: The Methodology
Our methodology involved:
- Feature Engineering: Creating “hints” for the model (e.g., volatility measures, moving averages).
- Machine Learning: Using the XGBoost regressor (a powerful algorithm).
- Evaluation: Rigorous testing to measure prediction accuracy.
A Closer Look at the Results
Here’s a glimpse into our commodity-specific findings:
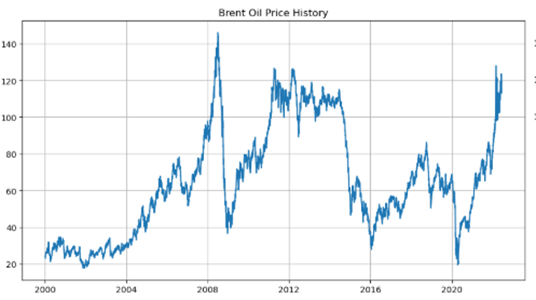
- Brent Crude Oil: Long-term price shift (~<span class=”math-inline”>20/barrel in 2000 to ~\$\~40-60 post-2004), major event impact (2008 crisis: ~\$\~140 to ~\~40).
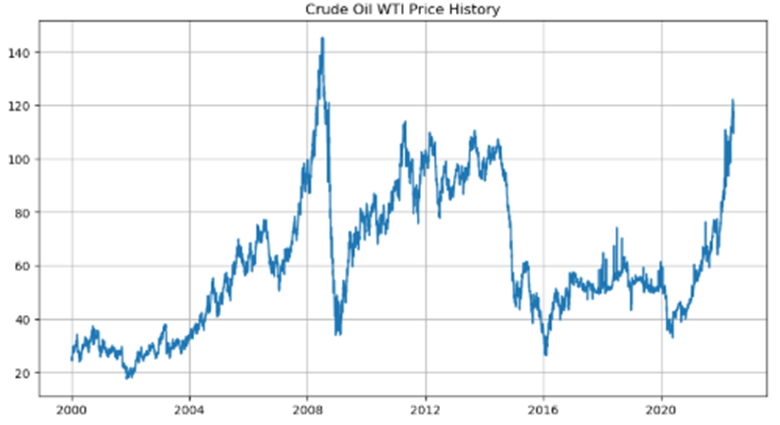
- WTI Crude Oil: Similar trends to Brent, but with key differences in spread and volatility.
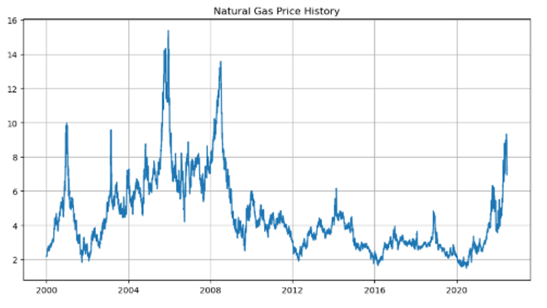
- Natural Gas: High volatility, structural shifts (e.g., “Lower Forever” regime post-2010), weather-driven spikes.
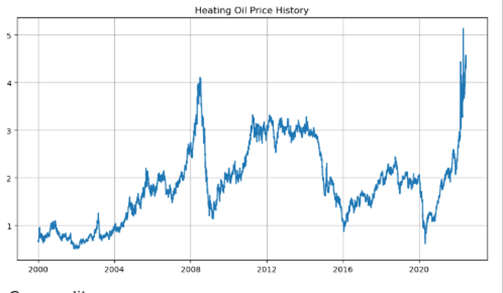
- Heating Oil: Strong seasonality (winter premiums), influenced by crude oil and refining costs.
Model Diagnostics: Checking Under the Hood
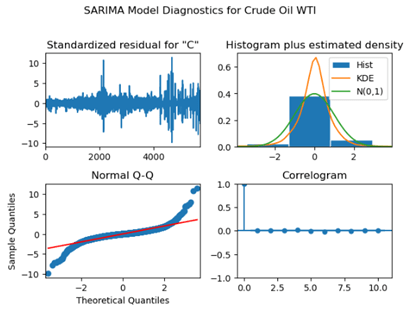
We validated the model by analyzing residuals (errors) for patterns, heteroscedasticity (unequal variance), and autocorrelation.
The Big Picture: Project Recap
. This project successfully developed an XGBoost model to forecast oil prices across multiple commodities, demonstrating strong short-term prediction and valuable insights into market dynamics.
Where to Go Next
Future work could involve building a real-time API, an interactive dashboard, and incorporating more data sources.





Leave a comment